Active connections: 291
server accepts handled requests
  16630948 16630948 31070465
Reading: 6 Writing: 179 Waiting: 106
However, the information Nginx provides above is a bit cryptic. Furthermore, if you need to monitor several Nginx servers, things can quickly go out of control. Isn't it nice for systemadin to have the stats organize into columns? Better yet, can we keep tracking all stats continuously with a nice graph?
Monitis (https://www.monitis.com/), a hosted statistics and monitoring provider, can organize those Nginx statistics for you. Once you have a Monitis account, you can create several custom monitors, and track several Nginx servers at once. Everything is inside your Monitis Dashboard. We've demonstrated the solution for Integrate Apache Monitoring into Monitis.com. Today we'll show you how to achieve this for Nginx.

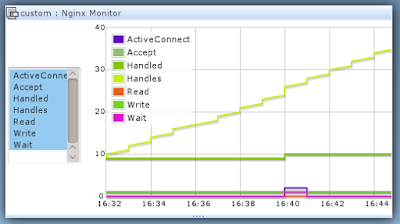
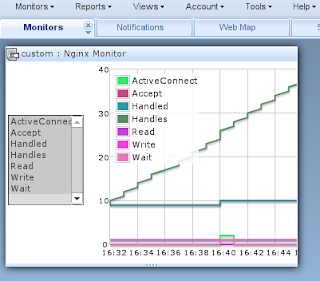
Figure 1: Monitis shows a nice graph for Nginx Stub Staus.

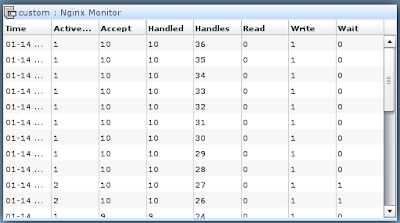
Figure 2: Monitis provides a cleaner output for Nginx Server Stats.
Automatically Feed Nginx Statistics to Your Monitis account
Let's quickly show an available program to do this. In 5 steps, you can fetch your Nginx stats and send them to your Monitis account periodically.
1. You Nginx stub_status module is installed.
2. Edit your nginx.conf, so that Nginx knows the url for stats. Here we use port 80, listen on localhost with address of nginx_status. i.e.
server {
listen 80;
server_name localhost;
location /nginx_status {
stub_status on;
access_log off;
allow 127.0.0.1;
deny all;
}
i.e. with the configuration above, you can view the original Nginx stats @ http://localhost/nginx_status
3. Start your Nginx Server with Stub Status enable
4. Download the code and run the program.(required .Net 3.5+)
On your windows command line, run the program like this:
monitis_nigix_stats.exe "[apikey]" "[secretkey]" "[monitorname]" "[minitortag]" "[nginx stub status url]"
For example,assume you already have a Monitis account:
monitis_nginx_stats.exe "14NAC40PIMSUEEBQFJOQL18T5U" "74H6U7A2DG71JU80QR48FEOPAL" "Nginx Monitor" "Nginx+Stub+Status" "http://localhost/nginx_status"
*note: please register to get your free apiKey and secreKey from Monitis
https://www.monitis.com/free_signup.jsp
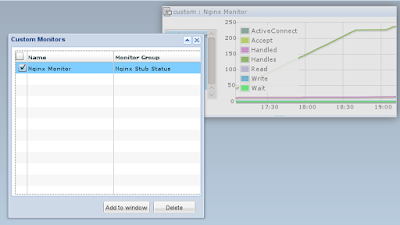
5. Log in to your Monitis account, you can see a new custom monitor ready to be added (Monitors->Manage Monitors->Custom Monitors). Check and add your new monitor to your dashboard.

6. You are all set.

Conclusion:
In this article, we demonstrate Monitis' enterprise solution in Nginx monitoring. Now statistics from Nginx are eye-candy to view, and we can gather data from several Nginx servers in a single dashboard. The code example above is in C#. However, Monitis provides opensource library (SDK) and scripts available for your custom monitors. You are free to pick a SDK in your favorite language, or simply integrate the already working script with your Monitis account. Get your free registration at https://www.monitis.com/free_signup.jsp
Happy Nginx monitoring!
The Monitis Team
External Scripts:
Nginx Monitoring in Python
https://github.com/crystalcoding/Monitis-Scripting/tree/master/python
Nginx Monitoring in C#
https://github.com/crystalcoding/Monitis-Scripting/tree/master/csharp
External Links for further information:
http://monitis.com/api/api.html#addCustomMonitor
https://www.monitis.com/free_signup.jsp25 Apache Performance Tuning Tips
No comments:
Post a Comment